The film industry’s modern “baseline” now spans theatrical box office, streaming/home entertainment, and a large production supply chain. The latest multi-year benchmarks below show how far theatrical revenue has recovered from the 2020 low, how North America compares to pre-pandemic totals, and how pricing has trended.
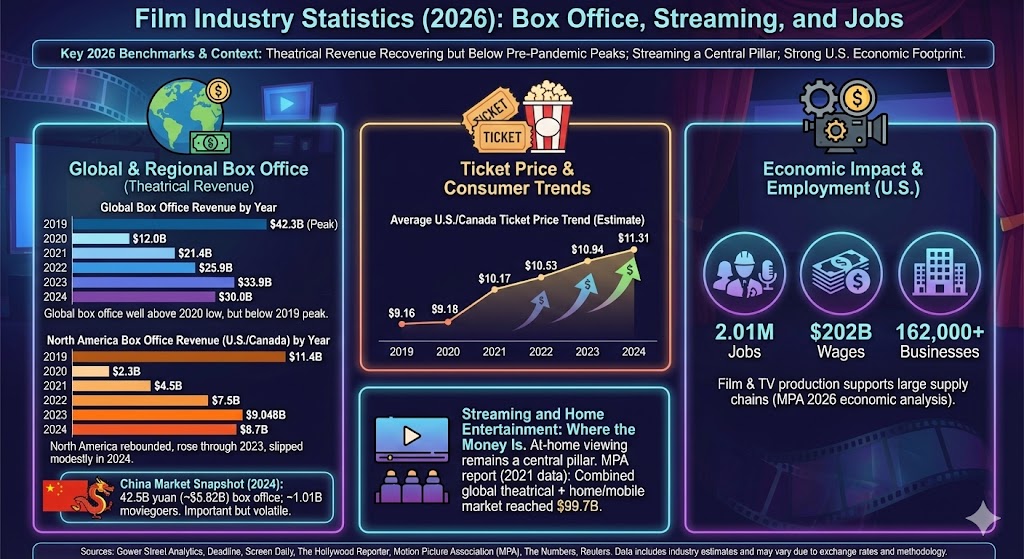
Pre-pandemic global benchmark (2019): $42.3B worldwide.
North America box office (2024): $8.7B (U.S./Canada).
North America box office (2023): $9.048B (U.S./Canada).
Average ticket price (2024): $11.31 (U.S./Canada estimate).
China box office (2024): 42.5B yuan (about $5.82B) and ~1.01B moviegoers.
U.S. industry footprint (MPA): 2.01M jobs, $202B wages, 162,000+ businesses.
Global box office revenue by year
Global theatrical revenue is well above the 2020 trough but remains below the 2019 peak. Figures below are widely cited industry estimates, and minor differences can occur across trackers due to exchange rates and methodology.
North America rebounded strongly after 2020, rose through 2023, and slipped modestly in 2024. These totals are commonly cited for the U.S./Canada theatrical market.
Ticket prices have generally climbed year over year. Higher prices can lift topline revenue, but admissions and the volume of wide releases still matter heavily for annual box office totals.
Streaming and home entertainment: where the money is
At-home viewing remains a central pillar of the film economy. One widely cited benchmark: the Motion Picture Association reported the combined global theatrical and home/mobile entertainment market reached $99.7B in 2021 (with digital representing the majority share of that combined market).
Employment and economic footprint
Film and TV production supports large supply chains (production services, post, marketing, distribution, and more). The Motion Picture Association’s 2026 economic analysis reports the American film and television industry supports 2.01M jobs, pays $202B in wages, and comprises more than 162,000 businesses.
China market snapshot
China remains one of the most important theatrical markets, but it can swing sharply year to year. China’s 2024 box office totaled 42.5B yuan (about $5.82B), and reported moviegoers fell to about 1.01B.
Sources
Gower Street Analytics (Jan 8, 2025) — 2024 global box office total ($30.0B). https://gower.st/articles/sparkling-december-finishes-2024-high-3bn-global-box-office-2024-total-30bn/
Gower Street Analytics (Jan 4, 2024) — 2023 global box office total ($33.9B). https://gower.st/articles/gower-street-analytics-estimates-2023-global-box-office-hit-33-9-billion/
Gower Street Analytics (Jan 5, 2023) — 2022 global box office total ($25.9B). https://gower.st/articles/gower-street-estimates-2022-global-box-office-hit-25-9-billion/
Gower Street Analytics (Jan 6, 2022) — 2021 global box office finished at $21.4B and cites 2020 at $12.0B. https://gower.st/articles/despite-strong-finish-2021-ends-year-well-below-pre-pandemic-levels/
Gower Street Analytics (Dec 18, 2025) — cites 2019 global box office ($42.3B). https://gower.st/articles/forecast-2026-gower-street-announces-35-billion-global-box-office-estimate/
Screen Daily (Jan 4, 2024) — final 2023 North America box office $9.048B (Comscore). https://www.screendaily.com/news/north-american-box-office-reached-9bn-in-2023/5189155.article
Screen Daily (Jan 3, 2023, updated) — 2022 North American box office finished on $7.5B (Comscore). https://www.screendaily.com/features/north-american-box-office-up-64-in-2022-but-hollywood-frets-over-prestige-films-updated/5177754.article
The Hollywood Reporter (Jan 1, 2021) — 2020 domestic box office fell to about $2.3B. https://www.hollywoodreporter.com/movies/movie-news/its-official-2020-domestic-box-office-fell-80-percent-to-2-3b-behind-chinas-2-7b-4110745/
Motion Picture Association (2021 THEME Report PDF, Mar 2022) — U.S./Canada box office $4.5B in 2021; combined global theatrical + home/mobile market $99.7B in 2021. https://www.motionpictures.org/wp-content/uploads/2022/03/MPA-2021-THEME-Report-FINAL.pdf
The Numbers (Mar 12, 2025) — average ticket price estimate ($11.31 in 2024; includes recent-year series context). https://www.the-numbers.com/news/258910830-Movie-theater-ticket-prices-rose-3-to-11-31-in-2024
Motion Picture Association (Feb 10, 2026) — U.S. industry jobs/wages/business counts. https://www.motionpictures.org/research-docs/the-american-motion-picture-and-television-industry-creating-jobs-trading-around-the-world-2024/
Reuters (Jan 1, 2025) — China 2024 box office (42.5B yuan) and ~1.01B moviegoers. https://www.reuters.com/business/media-telecom/china-2024-box-office-revenue-plunges-industry-downturn-deepens-2025-01-01/